top button
Flag Notify
    Connect to us
      Site Registration

Site Registration

Small Discussion About Dimple.Js?

0 votes
303 views

What is Dimple ?
The aim of dimple is to open up the power and flexibility of d3 to analysts. It aims to give a gentle learning curve and minimal code to achieve something productive. It also exposes the d3 objects so you can pick them up and run to create some really cool stuff.

Dimple is a library to aid in the creation of standard business visualisations based on d3.js.

The dimple api uses a handful of fundamental objects for chart creation. This is a deviation from the functional chaining pattern of d3, however it should be familiar to those of you coming from many other commercial charting applications.

To allow you to tinker with the inner workings, dimple exposes all its methods and properties. However it is highly recommended that you stick to the stuff that's supposed to be public, therefore any properties or methods which do not form part of the official public API will be prefixed with an underscore (_).

Example Code

var chart = new dimple.chart(svg, data);
chart.addCategoryAxis("x", "Region");
chart.addMeasureAxis("y", "Volume");
chart.addSeries("Brand", dimple.plot.bar);
chart.draw();


Video for Dimple.Js

posted Dec 1, 2016 by Manish Tiwari

  Promote This Article
Facebook Share Button Twitter Share Button LinkedIn Share Button


Related Articles

What is D3.js?

D3.js is a JavaScript library for manipulating documents based on data.

D3 helps you bring data to life using HTML, SVG and CSS.

Basically Using D3.Js we can easily visualize the data's.

There are many library for viualize the data as graphs.But the beauty of d3.js is SVG (Scalable Vector Graphics) based.We can easily create and show any type of visualizing not only like line chart,bubble chart,area chart etc.Also,We can create based on our choice.

SVG

What is SVG mean?

SVG stands for Scalable Vector Graphics.
SVG is used to define vector-based graphics for the Web
SVG defines the graphics in XML format
SVG graphics do NOT lose any quality if they are zoomed or resized
Every element and every attribute in SVG files can be animated

Sample Simple Graphs Using D3.Js
enter image description here


Sample Advanced Graphs
enter image description here

Refer More Examples at : http://d3js.org/

Video Tutorial about D3.Js

https://www.youtube.com/watch?v=n5NcCoa9dDU

This is the Basic introduction about D3.js.I hope you all now know what is d3.js.In future article i will tell you how to start write coding using D3.Js

READ MORE

In this article using SVG (Scalable Vector Graphics) we can create the bar chart.Last three articles we are seeing about the bar chart creation in different ways.

So in this article also we are going to see for creating bar chart using svg

Comparing div and svg

SVG would be easier for you, since selection and moving it around is already built in. SVG objects are DOM objects, so they have "click" handlers, etc.

DIVs are okay but clunky and have awful performance loading at large numbers.

Also see some of the similarities between svg and html

You can write SVG markup and embed it directly in a web page (provided you use <!DOCTYPE html>). You can inspect SVG elements in your browser’s developer tools. And SVG elements can be styled with CSS, albeit using different property names like fill instead of background-color. However, unlike HTML, SVG elements must be positioned relative to the top-left corner of the container; SVG does not support flow layout or even text wrapping.

Now we will see the same example which we seen in last article.But in program is created using svg

<!DOCTYPE html>
 <html>
  <head>
    <style>
    .chart rect {
      fill: steelblue;
    }
    .chart text {
      fill: white;
      font: 10px sans-serif;
      text-anchor: end;
    }

    </style>
    </head>
     <body>
    <svg class="chart" width="420" height="120">
      <g transform="translate(0,0)">
        <rect width="40" height="19"></rect>
        <text x="37" y="9.5" dy=".35em">4</text>
      </g>
      <g transform="translate(0,20)">
        <rect width="80" height="19"></rect>
        <text x="77" y="9.5" dy=".35em">8</text>
      </g>
      <g transform="translate(0,40)">
        <rect width="150" height="19"></rect>
        <text x="147" y="9.5" dy=".35em">15</text>
      </g>
      <g transform="translate(0,60)">
        <rect width="160" height="19"></rect>
        <text x="157" y="9.5" dy=".35em">16</text>
      </g>
      <g transform="translate(0,80)">
        <rect width="230" height="19"></rect>
        <text x="227" y="9.5" dy=".35em">23</text>
      </g>
      <g transform="translate(0,100)">
        <rect width="420" height="19"></rect>
        <text x="417" y="9.5" dy=".35em">42</text>
      </g>
    </svg>
     </body>
     </html>

Output for above program
enter image description here

But unlike the div elements that were implicitly positioned using flow layout, the SVG elements must be absolutely positioned with hard-coded translations relative to the origin.

Normally svg doesn't support all styles which are all supported by html.So take a look for understanding about the svg styles by using the below link.

http://www.w3.org/TR/SVG/styling.html

So next articles we will see more about svg and some more charts.

READ MORE

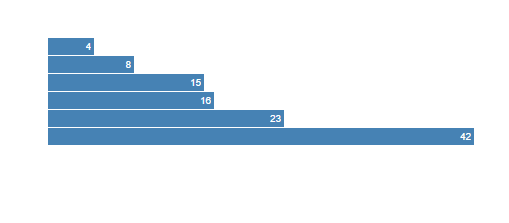
In my last article i was created a bar chart with using javascript.I simply created using html and css.

This article we going to see how to create a graph with using d3.js

First,In java script prepare the data sets

var data = [4, 8, 15, 16, 23, 42];

Based on the above number of data's we create a separate div for each.

So first create a styles for bar chart

<style>

.chart div {
  font: 10px sans-serif;
  background-color: steelblue;
  text-align: right;
  padding: 3px;
  margin: 1px;
  color: white;
}

</style>

Also,Create a placeholder for chart

<div class="chart"></div>

Then using Linear scales method in d3 we can map a continuous input domain to a continuous output range.

D3’s scales specify a mapping from data space (domain) to display space (range)

var x = d3.scale.linear()
    .domain([0, d3.max(data)])
    .range([0, 420]);

Although x here looks like an object, it is also a function that returns the scaled display value in the range for a given data value in the domain. For example, an input value of 4 returns 40, and an input value of 16 returns 160.

Then using d3 functions select and selectAll to select the placeholder part and plot the data's

d3.select(".chart")
  .selectAll("div")
    .data(data)
  .enter().append("div")
    .style("width", function(d) { return x(d) + "px"; })
    .text(function(d) { return d; });

From the above code select is used to select the container (In this program .chart is the container)

selectAll method is used to select all the elements.Here it will select all the div.In d3 using data we will pass the datas.So in above programs based on the datas it append the number div using append method.

Using style method it will set the styles.In above program width will set based on the datas and text method used to set the text.

Full Code
<!DOCTYPE html>
<html>
<head>
<meta charset="utf-8">
<style>

.chart div {
  font: 10px sans-serif;
  background-color: steelblue;
  text-align: right;
  padding: 3px;
  margin: 1px;
  color: white;
}

</style>
</head>
<body>
<div class="chart"></div>
<script src="http://d3js.org/d3.v3.min.js"></script>
<script>

var data = [4, 8, 15, 16, 23, 42];

var x = d3.scale.linear()
    .domain([0, d3.max(data)])
    .range([0, 420]);

d3.select(".chart")
  .selectAll("div")
    .data(data)
  .enter().append("div")
    .style("width", function(d) { return x(d) + "px"; })
    .text(function(d) { return d; });

</script>
</body>
</html>

Output for the above code:
enter image description here

READ MORE

What is Polymer.Js?

Polymer.js is a JavaScript library created by Google that allows reusing the HTML elements for building applications with components. Polymer is an open-source JavaScript library developed by Google developers

Polymer provides a number of features over vanilla Web Components:

  • Simplified way of creating custom elements
  • Both One-way and Two-way data binding
  • Computed properties
  • Conditional and repeat templates
  • Gesture events

Polymer.js places a hefty set of requirements on the browser, relying on a number of technologies that are in still in the process of standardization (by W3C) and are not yet present in today’s browsers. 

Examples include the shadow dom, template elements, custom elements, HTML imports, mutation observers, model-driven views, pointer events, and web animations. These are marvelous technologies, but at least as of now, that are yet-to-come to modern browsers.

The Polymer strategy is to have front-end developers leverage these leading-edge, still-to-come, browser-based technologies, which are currently in the process of standardization (by W3C), as they become available. 

The recommended polyfills are designed in such a way that (at least theoretically) will be seamless to replace once the native browser versions of these capabilities become available.

Video for Polymer.Js
https://www.youtube.com/watch?v=tvafAyxkuVk

READ MORE

What is Axios?

Axios is a promise-based HTTP client that works both in the browser and in a node.js environment. It basically provides a single API for dealing with XMLHttpRequest s and node's http interface. Besides that, it wraps the requests using a polyfill for ES6 new's promise syntax

Node Command

npm install axios

Bower Command

bower install axios

Features

  • Make XMLHttpRequests from the browser
  • Make http requests from node.js
  • Supports the Promise API
  • Intercept request and response
  • Transform request and response data
  • Cancel requests
  • Automatic transforms for JSON data
  • Client-side support for protecting against XSRF

The user interface is split up into three sections:

  • GET Request
  • GET Request with Parameters
  • POST Request

With each of these three sections the user is able to try out a specific use case for Axios.

Video for Axios

https://www.youtube.com/watch?v=1vbpBDWu1AQ

READ MORE

What is KeyStone.Js?
KeystoneJS is a powerful Node.js content management system and web app framework built on express and mongoose. Keystone makes it easy to create sophisticated web sites and apps, and comes with a beautiful auto-generated Admin UI.

KeystoneJS is the easiest way to build database-driven websites, applications and APIs in Node.js.

Features:

  • Express.js and MongoDB
  • Dynamic Routes
  • Database Fields
  • Auto-generated Admin UI
  • Simpler Code
  • Form Processing
  • Session Management
  • Email Sending

Keystone uses Mongoose, the leading ODM for node.js and MongoDB, and gives you a single place for your schema, validation rules and logic.

Keystone can configure Express for you, or you can take over and treat Keystone like any other Express middleware.

You can also easily integrate it into an existing Express app.

NPM Command
npm install -g generator-keystone

YO Generator
$ yo keystone


Video for KeyStone.JS

https://www.youtube.com/watch?v=DPXDFeUEk3g

READ MORE

What is Synaptic ?

Synaptic is a javascript neural network library for node.js and the browser, its generalized algorithm is architecture-free, so you can build and train basically any type of first order or even second order neural network architectures.

This library includes a few built-in architectures like multilayer perceptrons, multilayer long-short term memory networks (LSTM), liquid state machines or Hopfield networks, and a trainer capable of training any given network, which includes built-in training tasks/tests like solving an XOR, completing a Distracted Sequence Recall task or an Embedded Reber Grammar test, so you can easily test and compare the performance of different architectures.

Npm Command

npm install synaptic --save

Bower Command

bower install synaptic

Sample Layer created using Synaptic:

Video for Synaptic  

https://www.youtube.com/watch?v=tUIEeCO_pZg

READ MORE
...